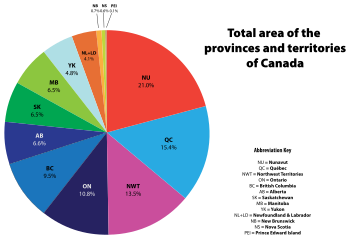
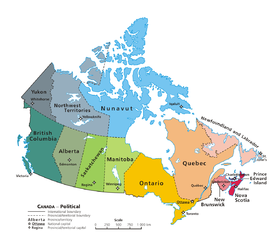
कनाडा के प्रांत आ राज्यक्षेत्र सभ के रकबा अनुसार लिस्ट
एगो देस के रूप में, कनाडा में दस गो प्रांत आ तीन गो राज्यक्षेत्र बाड़ें। ई उपबिभाग सभ जमीनी आ पानी वाला एरिया के मामिला में भारी बिबिधता लिहले बाड़ें। एह देस के सभसे बड़हन उपबिभाग नुनावुत हवे जे एगो राज्यक्षेत्र (टेरिटरी) हवे जबकि प्रांत(प्रोविंस) सभ में सभसे बड़ क्यूबेक हवे। पानी के क्षेत्र वाला रकबा के हिसाब से सभसे बड़ क्यूबेक हवे। सभसे छोट उपबिभाग, जमीनी आ पानी वाला एरिया, दुनों तरीका से, प्रिंस एडवर्ड दीप हवे।[1]

Canada is the second-largest country in the world; it has the fourth-largest dry land area, and the largest freshwater area.[2]
लिस्टिंग
संपादन करींकुल रकबा
संपादन करींThe total area of a province or territory is the sum of its land area and the area of its internal water (freshwater only).
Areas are rounded to the nearest square kilometre or square mile. Percentages are given to the nearest tenth of a percent.
| Rank | Name | Total area (km2)[1] | Total area (mi2)[1] | Percentage of national total area[1] |
|---|---|---|---|---|
| 1 | Nunavut | 2,093,190 | 2.2530909645153×10¹³ | 21.0% |
| 2 | Quebec | 1,542,056 | 1.6598552641550×10¹³ | 15.4% |
| 3 | Northwest Territories | 1,346,106 | 1.4489364395395×10¹³ | 13.5% |
| 4 | Ontario | 1,076,395 | 1.1586219352994×10¹³ | 10.8% |
| 5 | British Columbia | 944,735 | 1.0169042907530×10¹³ | 9.5% |
| 6 | Alberta | 661,848 | 7.124072581478×10¹² | 6.6% |
| 7 | Saskatchewan | 651,036 | 7.007693182053×10¹² | 6.5% |
| 8 | Manitoba | 647,797 | 6.972828876213×10¹² | 6.5% |
| 9 | Yukon | 482,443 | 5.192973233169×10¹² | 4.8% |
| 10 | Newfoundland and Labrador | 405,212 | 4.361665667776×10¹² | 4.1% |
| 11 | New Brunswick | 72,908 | 7.84775180661×10¹¹ | 0.7% |
| 12 | Nova Scotia | 55,284 | 5.95072023477×10¹¹ | 0.6% |
| 13 | Prince Edward Island | 5,660 | 6.0923732959×10¹⁰ | 0.1% |
| Total | Canada | 9,984,670 | 1.0747409342040×10¹⁴ | 100.0% |
जमीनी रकबा
संपादन करींLand areas consist of dry land, including[स्पष्टीकरण जरूरी] areas of freshwater, and or salt water.
Areas are rounded to the nearest whole unit. Percentages are given to the nearest tenth of a percent.
| Rank | Name and flag | Land area (km2)[1] | Land area (mi2)[1] | Percentage of national land area |
|---|---|---|---|---|
| 1 | Nunavut | 1,936,113 | 2.0840146888627×10¹³ | 21.3% |
| 2 | Quebec | 1,365,128 | 1.4694115499342×10¹³ | 15.0% |
| 3 | Northwest Territories | 1,183,085 | 1.2734620955353×10¹³ | 13.0% |
| 4 | British Columbia | 925,186 | 9.958619222794×10¹² | 10.4% |
| 5 | Ontario | 917,741 | 9.878481909742×10¹² | 10.1% |
| 6 | Alberta | 642,317 | 6.913842647130×10¹² | 7.1% |
| 7 | Saskatchewan | 591,670 | 6.368682876255×10¹² | 6.5% |
| 8 | Manitoba | 553,556 | 5.958427194632×10¹² | 6.1% |
| 9 | Yukon | 474,391 | 5.106302226493×10¹² | 5.2% |
| 10 | Newfoundland and Labrador | 373,872 | 4.024324715316×10¹² | 4.1% |
| 11 | New Brunswick | 71,450 | 7.69081399274×10¹¹ | 0.8% |
| 12 | Nova Scotia | 53,338 | 5.74125453806×10¹¹ | 0.6% |
| 13 | Prince Edward Island | 5,660 | 6.0923732959×10¹⁰ | 0.1% |
| Total | Canada | 9,093,507 | 9.7881694721723×10¹³ | 100.0% |
इंटरनल पानी क्षेत्र (ताजा-पानी/फ्रेशवाटर)
संपादन करींThe internal water area data below, includes freshwater (i.e., lakes, rivers, reservoirs, and canals). It excludes internal salt water and territorial waters claimed by Canada in the Atlantic, Pacific, and Arctic Oceans. Canada considers its internal water area to include 1,600,000 km2 of salt water in Hudson Bay and the ocean within and around Canada's Arctic Archipelago. Canada's territorial sea is 200,000 km2.[3][4][5]
Areas are given to the nearest whole unit. Percentages are given to the nearest tenth of a percent.
| Rank | Name and flag | Water area (km2)[1] | Water area (mi2)[1] | Water area as percentage of total area |
Percentage of national freshwater area |
|---|---|---|---|---|---|
| 1 | Quebec | 176,928 | 1.904437142208×10¹² | 11.5% | 19.9% |
| 2 | Northwest Territories | 163,021 | 1.754743440042×10¹² | 12.1% | 18.3% |
| 3 | Ontario | 158,654 | 1.707737443253×10¹² | 14.7% | 17.8% |
| 4 | Nunavut | 157,077 | 1.690762756526×10¹² | 7.5% | 17.6% |
| 5 | Manitoba | 94,241 | 1.014401681581×10¹² | 14.5% | 10.6% |
| 6 | Saskatchewan | 59,366 | 6.39010305798×10¹¹ | 9.1% | 6.7% |
| 7 | Newfoundland and Labrador | 31,340 | 3.37340952460×10¹¹ | 7.7% | 3.5% |
| 8 | British Columbia | 19,549 | 2.10423684736×10¹¹ | 2.1% | 2.2% |
| 9 | Alberta | 19,531 | 2.10229934349×10¹¹ | 3.0% | 2.2% |
| 10 | Yukon | 8,052 | 8.6671006675×10¹⁰ | 1.7% | 0.9% |
| 11 | Nova Scotia | 1,946 | 2.0946569671×10¹⁰ | 3.5% | 0.2% |
| 12 | New Brunswick | 1,458 | 1.5693781388×10¹⁰ | 2.0% | 0.2% |
| 13 | Prince Edward Island | 0 | 0 | 0.0% | 0.0% |
| Total | Canada | 891,163 | 9.592398698686×10¹² | 8.9% | 100.0% |
संदर्भ
संपादन करीं- ↑ 1.0 1.1 1.2 1.3 1.4 1.5 1.6 1.7 "Land and freshwater area, by province and territory". Statistics Canada. 2005-02-01. Archived from the original on 2011-05-24. Retrieved 2009-11-30.
- ↑ Field Listing:: Area. CIA World Factbook. Central Intelligence Agency. Archived from the original on 2014-01-31. Retrieved 2009-11-30.
- ↑ "The Arctic: Canada's Legal Claims". www.lop.parl.gc.ca. Archived from the original on 2016-03-06. Retrieved 2016-03-04.
- ↑ Canada, Government of Canada, Statistics. "Land and freshwater area, by province and territory". www.statcan.gc.ca. Retrieved 2016-03-04.
- ↑ Branch, Government of Canada, Fisheries and Oceans Canada, Communications. "Oceans". www.dfo-mpo.gc.ca. Retrieved 2016-03-04.
अउरी पढ़ल जाय
संपादन करीं- Moore, Christopher; Slavin, Bill; Janet Lunn (2002), The Big Book of Canada: Exploring the Provinces and Territories, Tundra Books, ISBN 0-88776-457-6
